
Decisions Through Data

Hi Folks,
Bitcoin’s price is hovering just above $67K at the time of writing. With my swing portfolio reduced, my next objective is lining up potential bottom/buying opportunities for BTC. And based on the data, the history suggests we have some time before the low is put in.
Let’s jump in.
Price Drawdowns from the All-Time High
This chart is one that I shared plenty of times during 2022 as we prepared to buy the bear market bottom.
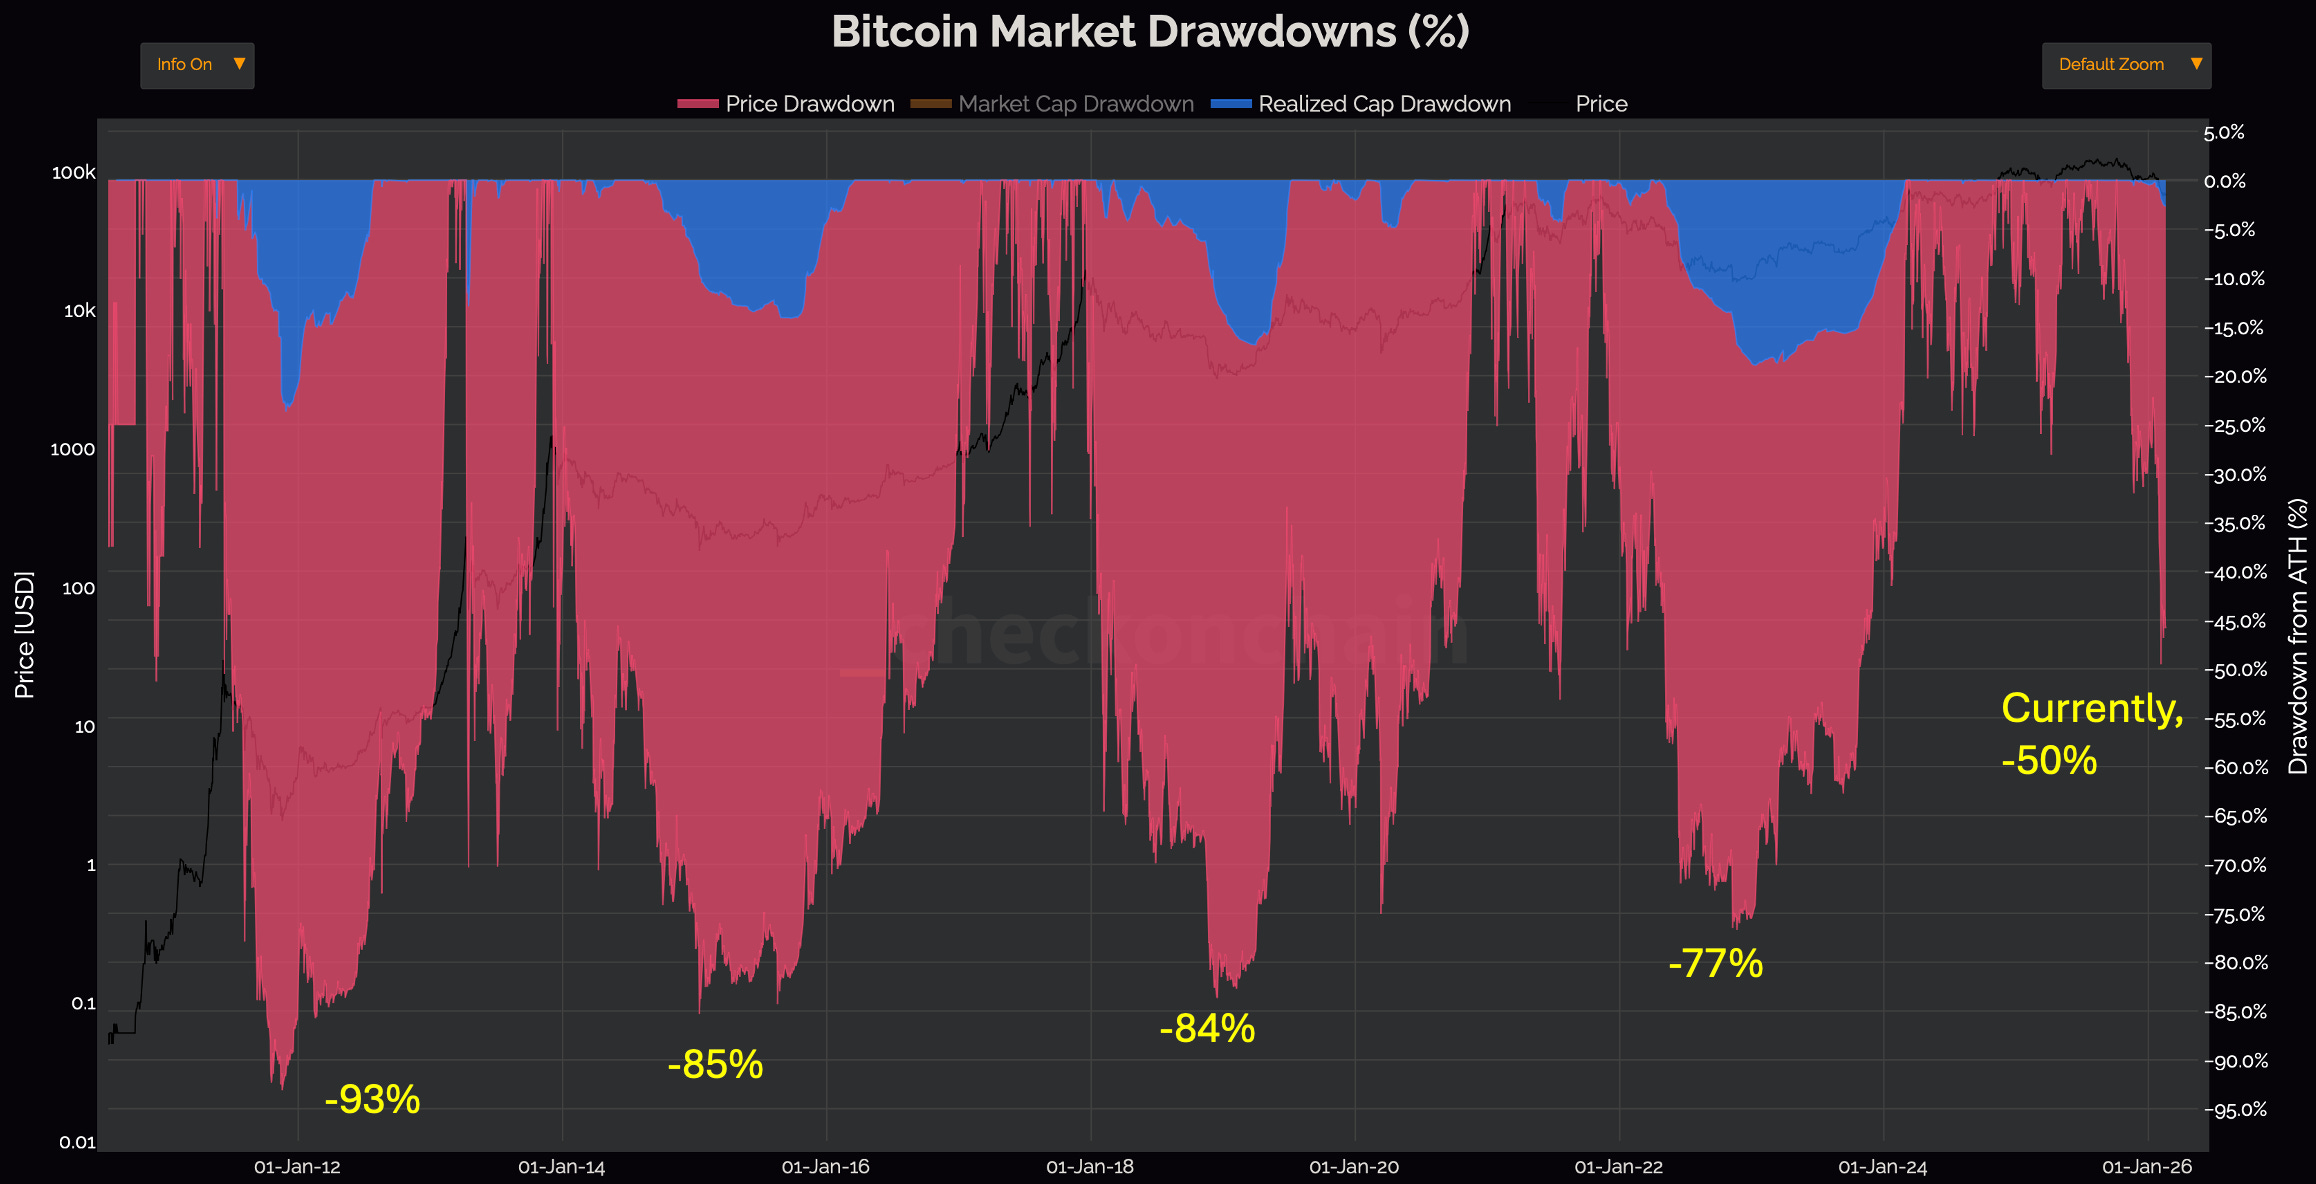
The deeper the red lines, the deeper the correction from the prior all-time high (ATH).
In 2011- Down 93% from the all-time high
2015- Down 85%
2018- Down 84%
2022- Down 77%
Currently, down 50% from the ATH.
I subscribe to the belief that since we didn’t get a blow-off top this bull cycle, that the bear market should also be more muted than the past.
That said, a 70% drawdown from the ATH would be muted compared to the past bear market bottoms and that puts BTC around $38K.
I posted this chart on X this morning to get a feel of sentiment before writing to you all. I did get a few comments saying that people think it’s not likely that BTC gets that low.
I tend to think that sentiment like that is exactly reasons why we need to prepare for scenarios like this.
Despite buy side momentum stalling and trend being bearish, we are still seeing cohorts that are holding off on capitulating.
The most reactive holders, short-term holders, that bought coins within the last week to 6 months ago,
OCC Newsletter is supported by @Binance. All analysis and opinions remain entirely my own.
